Daily note, Wednesday 21st October 2026
WTI: back above $100.4 into EIA
November expired at a steep premium to December, and without the expiry WTI's curve has barely moved. Brent Dec/Jan is firming, Cushing is building and the Gulf cash market is softening. WTI is back above the $100.4 dPoC into EIA. $102.4 is an exit, not a hold.
Levels in this post are from a CFD feed (USOUSD). Since 16th November 2026 the site uses NYMEX WTI and ICE Brent futures, so these levels sit at a basis to futures.
- Crude oil
-
WTI crude USOUSD
Bullish above $100.4
VaH$96.2Low$96.9dVaL$98.9dPoC$100.4dVaH$102.1nPoC$102.4$100.7
Buy zone Sell zone Price at 11:57 BST. dVaL, dPoC, dVaH: Tuesday's daily value. VaH: last week's 5-day composite VaH. Low: Tuesday's flush low. nPoC: naked PoC, week of 14th September.
Cracks, spreads, flows
November is off the board. It expired on Tuesday at a steep premium to December. December is the front now, and Dec/Jan is only marginally wider than last Thursday. Strip out the expiry and the WTI curve has barely moved since the EIA breakout.
Brent is doing the lifting. Brent Dec/Jan widened by almost a quarter since Friday. WTI flat, Brent firming. Europe is short prompt crude. The US hub isn't. The Brent–WTI arb is still wide enough to keep US barrels leaving.
Cushing keeps filling. API had the hub up another 0.9M bbl, after +1.9M in last week's EIA and +0.4M the week before. A building hub flattens WTI's curve. That's the drag on the WTI long.
Gulf cash is softening while futures hold. Gulf cargoes are available at short notice, and the Mideast sour benchmark is at a three-month low (Bloomberg). Physical in the Gulf and paper are pointing different ways. If futures start pricing the easier Gulf barrel, the premium comes out of flat price, not spreads.
Cracks: diesel holds, gasoline keeps sliding. Futures diesel cracks held again on Tuesday. The latest EIA spot data, for 13th October, has the Gulf Coast diesel crack at $110.2, gasoline at $47.5, down from $54.8 on 1st October, and the 3-2-1 at $68.4. Futures gasoline cracks have fallen further since. Margins are softening from the gasoline side. Diesel still pays refiners to run.
API: 4.9M bbl crude draw for the week to 16th October against about 1.3M expected. Gasoline down 2.0M, distillates down 2.6M, Cushing up 0.9M. EIA reports at 15:30 BST. A draw near the API number and $102.4 trades. A miss caps the top of value.
Tuesday's fade was diplomacy, not barrels. Crude came off its highs on hopes of US–Iran talks while tankers kept getting hit: Kpler counts at least 18 vessels fired on in two weeks, and the IRGC says two more tankers caught fire after hitting mines. The war premium trades headlines both ways. Vance already said on the 19th that the US had "in some ways" won decisively. A formal victory claim is the sell-the-news risk. Underneath: commercial crude 2.7% under the 5-year average, distillates 12.2% under in the week to 9th October. (Charts.)
The read: flat price above $100 has Brent's curve and the diesel crack behind it. WTI's own curve and hub aren't helping. That's why $102.4 is an exit, not a hold.
The auction
Tuesday stalled just under the $102.4 naked PoC and didn't trade it. Value built high: dVaH $102.1, dPoC $100.4, dVaL $98.9. Late in the session one hourly candle flushed to about $96.9, through dVaL and the old $97.3 VaH, and got bought straight back. Long tail, no follow-through. That's excess. It held above the $96.2 weekly pivot and the rising trendline from the 6th October low.
Since then: higher lows from $99.0 and back above dPoC. At 11:57 BST WTI is $100.7. A probe to about $101.3 this morning got sold, so the upper half of Tuesday's value isn't accepted yet.
Inside value, price rotates. Hold $100.4 and the top of value at $102.1 is next, then the $102.4 naked PoC Tuesday missed. Lose $100.4 and it's back to $98.9.
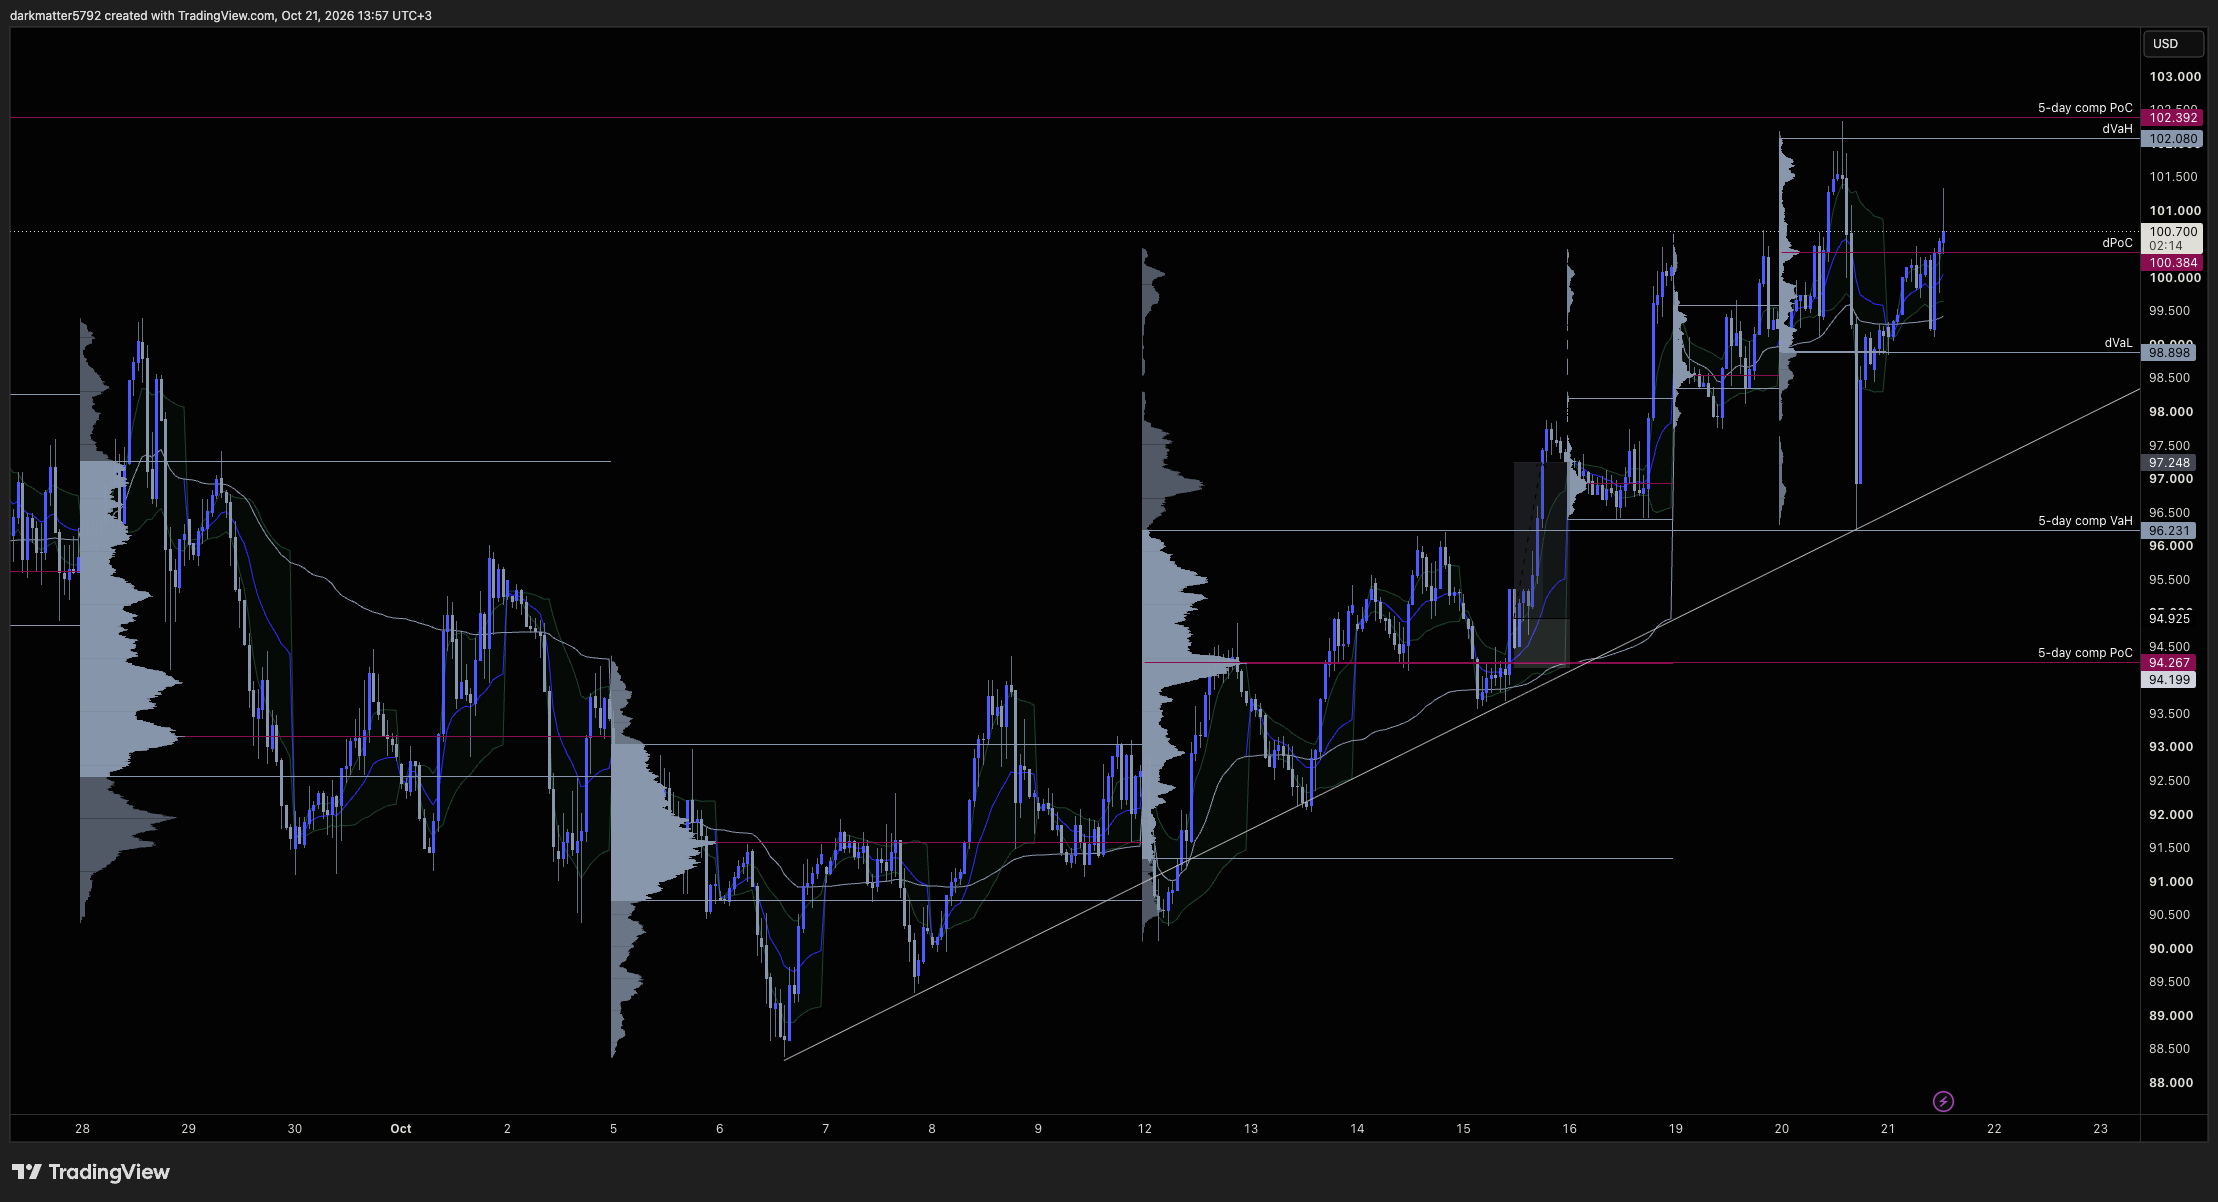
WTI levels and setups
Long above $100.4. Buy the dPoC retest at $100.2–100.5. Targets $102.1, then $102.4. If you're already long from Tuesday, $102.4 is still the exit.
Buy setup dPoC retest
- Buy zone
- $100.2 – $100.5 Tuesday's dPoC, retested from above
- Stop-loss
- $99.4 Back in the lower half of Tuesday's value
- Targets
- $102.1 / $102.4 Top of Tuesday's value, then the naked PoC, week of 14th September
Invalidation: Hourly acceptance below $100.4 sends price back to the $98.9 dVaL. No long today. Below $98.9, Tuesday's $96.9 flush low is next. The weekly view holds above $96.2.
| Level | What it is | Role today |
|---|---|---|
| $103.7 | VaH, week of 14th September | Resistance above the naked PoC |
| $102.4 | Naked PoC, week of 14th September | Target; expect sellers |
| $102.1 | Tuesday's dVaH | First target |
| $101.3 | This morning's high | First resistance |
| $100.4 | Tuesday's dPoC | Pivot; buy zone |
| $98.9 | Tuesday's dVaL | Bottom of value |
| $97.3 | VaH, week of 28th September | Support |
| $96.9 | Tuesday's flush low | Excess; has to hold |
| $96.2 | Last week's 5-day composite VaH | Weekly pivot |
Today's calendar (London time)
- 15:30: EIA Weekly Petroleum Status Report
Cracks and Dated Brent–WTI are calculated from EIA daily spot prices against WTI Cushing (latest published: Tuesday 13th October). Timespreads are described from futures settlements, not quoted. Prices are taken from a CFD feed (USOUSD) and can differ from futures prices and from your broker's quotes.