Weekly outlook, Week of 19th–23rd October 2026
WTI: above $96.2, target $102.4
The WTI curve steepened all week and took price out of value: prompt backwardation tripled, close at $100.2. But the Brent–WTI futures spread narrowed, Cushing is building and gasoline cracks are rolling over. Long above last week's $96.2 VaH, target the $102.4 naked PoC. A few-weeks view, not a winter view.
Levels in this post are from a CFD feed (USOUSD). Since 16th November 2026 the site uses NYMEX WTI and ICE Brent futures, so these levels sit at a basis to futures.
- Crude oil
-
WTI crude USOUSD
Bullish above $96.2
PoC$94.3VaH$96.2Sep VaH$97.3Wk high$100.5nPoC$102.4Sep high$106.8$99.4
Buy zone Sell zone Price at 11:00 BST on Monday. PoC, VaH: last week's 5-day composite. Sep VaH: week of 28th September. nPoC: naked PoC, week of 14th September. Wk high, Sep high: last week's and September's highs.
Cracks, spreads, flows
The war premium is fading. The physical market isn't loosening. Two things hold crude up this autumn. One is the war premium: fear of losing Gulf barrels. That's shrinking as tankers keep moving through Hormuz, and it's what sold off on Monday morning. The other is the physical barrel: the curve, refinery margins, export pull. That hasn't loosened. It shifted.
The curve steepened all the way out. On Friday's settles against the week before, WTI Nov/Dec tripled. Dec/Jan and Jan/Mar both widened by more than half. Prompt backwardation tripling while funds were cutting length (below) is physical buying. That's what took price out of value.
But the strength moved to WTI. The Brent–WTI Dec futures spread narrowed by a fifth. Brent Dec/Jan eased while WTI's spreads blew out. At spot the gap is still huge: Dated Brent was $30.4 over WTI Cushing on 13th October on EIA prices, against $4.5 at the start of September. The tightness started in the Atlantic Basin: Europe short crude, paying up for US barrels. Exports ran 4.57M b/d in the week to 9th October against a 4.05M 4-week average. Now WTI has caught up and the arb is narrowing. A narrower arb ships fewer barrels in November. That's the first crack in the long case.
The hub is the soft spot. Cushing 26.6M bbl, up two weeks running, 3.9% over the 5-year average. Coast stocks drain on exports while the hub fills. WTI's front spreads can't stay this wide with Cushing building. Watch it on Wednesday.
Diesel is the floor. The Gulf Coast diesel crack was $110.2 on 13th October on EIA spot prices, up from $95.5 a week earlier, and futures diesel cracks held steady all week. Distillates 12.2% under the 5-year average going into heating season. At that margin refiners run hard and keep buying crude. Washington's licence for Russian diesel helps at the margin, but Baltic cargoes take weeks to land.
Gasoline is the weak leg. The Gulf Coast gasoline crack fell from $53.5 to $47.5 in the week to 13th October on EIA spot prices, and futures gasoline cracks fell by a fifth over the week. Gasoline stocks 4.4% under average, but the crack is rolling over anyway. That's where refinery margin gets squeezed first.
US stocks are low. So is the SPR. Week to 9th October: commercial crude down 8.6M bbl to 415.6M, 2.7% under the 5-year average. The SPR holds 283M bbl, 35% under its 5-year average. Washington has less to release than in past shocks. Weekly US production fell 0.3M b/d to 13.68M from the 13.98M record after a hurricane shut in Gulf of Mexico platforms. Some is still offline. (Charts.)
Supply is still disrupted. Three tankers damaged in Hormuz at the weekend, and the IRGC Navy says ships pass only with its permission. Kpler has Hormuz oil flows 41% below pre-war. The US Energy Secretary says Gulf flows are about 80% of pre-war. Houthis targeted Yanbu. Ukrainian drones hit an export terminal and a storage depot in St Petersburg on Sunday. The October STEO has OPEC spare capacity near zero, unplanned OPEC outages at 7.6M b/d in Q3, and a 0.7M b/d Q4 deficit.
Demand is holding. China Q3 GDP +4.5% y/y against 4.4% expected. September retail sales and industrial production both beat.
Funds aren't crowded. Managed money net long 40,600 WTI contracts in the week to 13th October, down from 111,700 in early September. They cut length all the way up from the October low, and that data predates Thursday's breakout. The spreads did the lifting, not the funds. Room to chase.
What slows it. Jan/Mar this steep prices a tight Q1 for WTI. US Gulf Coast refineries go into maintenance in January and crude demand drops just as the arb closes. That's the part of the curve most likely to give. Add the IEA's last 100M bbl of stock release and Washington delaying Russia sanctions. Any credible sign Hormuz traffic is normalising hits the premium fast.
Last week
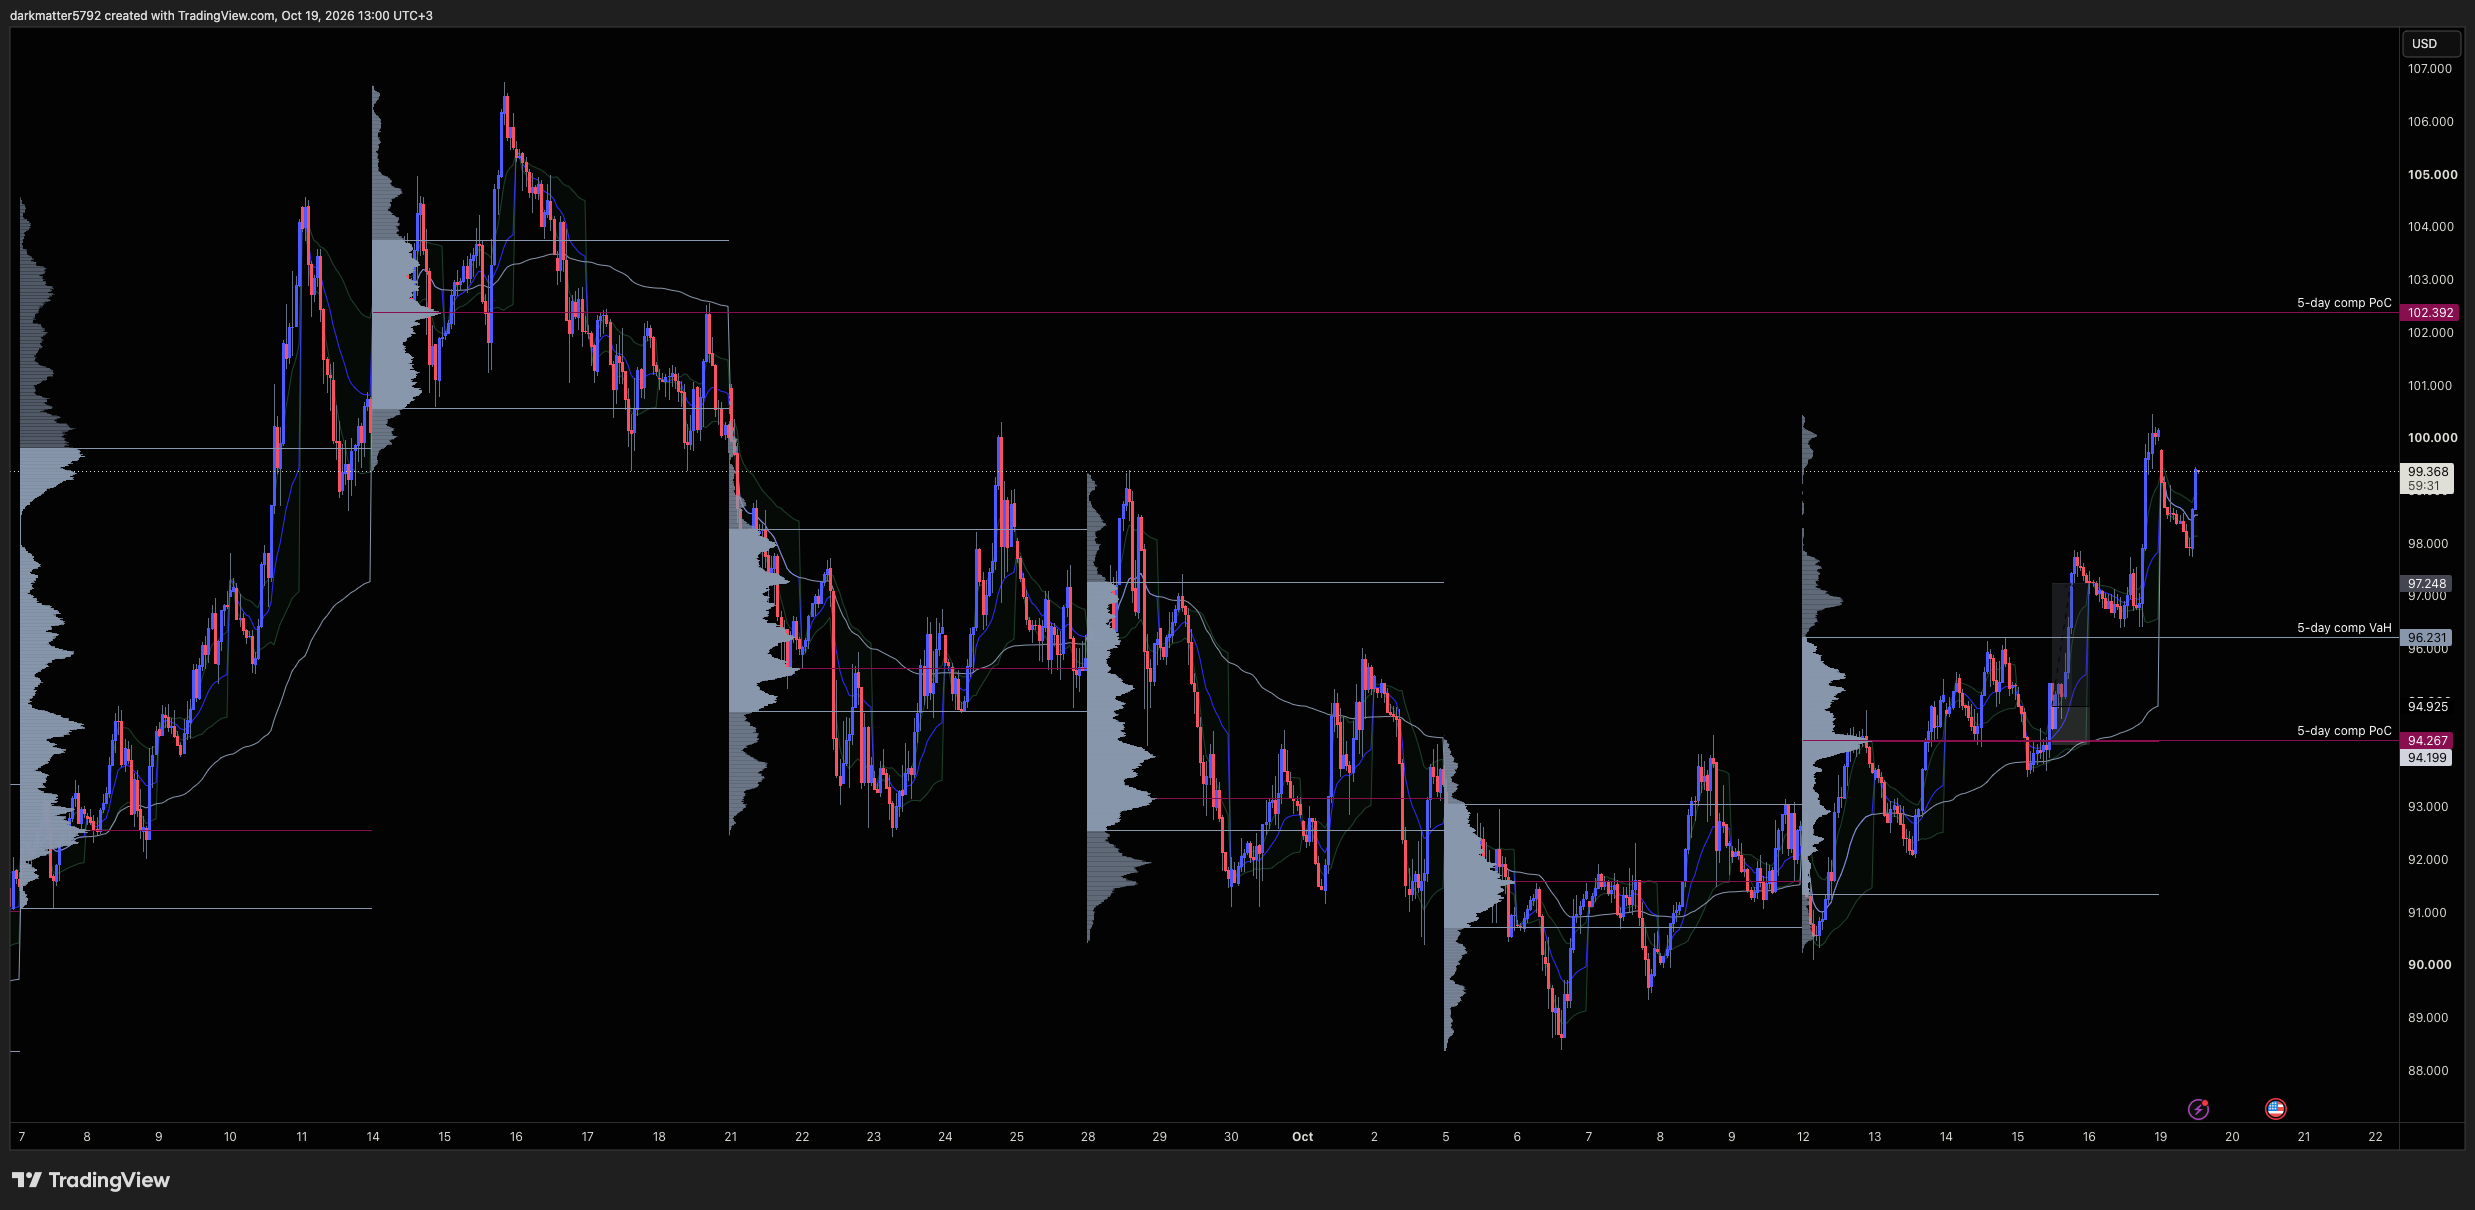
Trend week. WTI opened $92.4, made the low at $90.1 on Monday, then went higher every day. Tuesday and Wednesday built value between about $93 and $96, composite PoC $94.3. Thursday's 8.6M bbl EIA draw took price out of that value and through $97.3, the VaH from the week of 28th September. Friday ran to $100.5 and closed $100.2, near the high. Up about 8% on the week.
That close matters. Every weekly value area since the September sell-off sat below $98.3, and the low came in at $88.4 on 6th October. Last week closed above all of it, at the top of the range, with the curve steepening underneath. Buyers in control into the weekend.
Monday opened just under $100 and dipped to $97.7 by 09:30 BST on the delayed US sanctions on Russia and better Gulf flows. The dip held above $97.3, the old VaH broken on Thursday, and by 11:00 BST WTI was back at $99.4. Breakout, retest, hold. That's acceptance: headline selling absorbed at the top of old value while the barrel stays short.
The bigger picture
Above last week's high the profile is thin up to September value. First shelf: the PoC from the week of 14th September at $102.4, untouched since price left it on 18th September. Naked PoC, main target for the week. Above that, the September high at $106.8.
Below, last week's value: VaH $96.2, PoC $94.3. After an accepted break out of value, the old VaH is support. That's where the pullback buy sits.
Scenarios for the week
- Base case: pullback, then higher. Holds $96.2, builds value in the high 90s, takes out $100.5. Daily close above $100.5 opens $102.4.
- Straight up. Another supply headline takes price through $100.5 without a pullback. The pullback buy is missed. Don't chase. The daily notes will have new levels.
- Escalation. US forces are building in the region ahead of the Israeli election on 27th October and the US elections on 3rd November. Strike risk is rising. A fresh hit on Gulf infrastructure takes price through $100.5 to $102.4 fast, Brent leading. Weekend holds carry gap risk both ways.
- Back into value. Daily close below $96.2: breakout failed for now, rotation to last week's $94.3 PoC. Below $94.3, the long case is off for the week.
November WTI expires on Tuesday. Expect the Nov/Dec spread to swing on the roll. Read Dec/Jan for the real signal.
WTI levels and setups
Long. Buy the pullback into last week's VaH. No short this week: a close back below $96.2 means flat, not short, against this backdrop.
Buy setup pullback into value
- Buy zone
- $96.2 – $96.8 Retest of last week's composite VaH from above
- Stop-loss
- $95.4 Back inside last week's value, under Thursday's breakout
- Targets
- $100.5 / $102.4 Last week's high, then the naked PoC, week of 14th September
Invalidation: Daily close below $96.2: back in last week's value, no pullback buy. Daily close below $94.3, last week's PoC: bullish bias off for the week. Between the two, flat.
| Level | What it is | Role this week |
|---|---|---|
| $106.8 | September high | Major resistance |
| $103.7 | VaH, week of 14th September | Resistance above the naked PoC |
| $102.4 | Naked PoC, week of 14th September | Main target |
| $100.5 | Last week's high | Breakout level; first target |
| $97.7 | Monday's low | First support |
| $97.3 | VaH, week of 28th September | Thursday's breakout level; support |
| $96.2 | Last week's 5-day composite VaH | Weekly pivot; buy zone |
| $94.3 | Last week's 5-day composite PoC | Bias flips below |
| $91.4 | Last week's 5-day composite VaL | Bottom of last week's value |
| $88.4 | October low (6th October) | Major support |
What would change the view
Daily close below $94.3: back in last week's value, breakout rejected. In the barrel: WTI Dec/Jan back to where it started last week with flat price still up means the rally has lost its physical bid. Fundamentally, a ceasefire or a verified return to normal Hormuz traffic strips most of the premium. Any of these, bias back to neutral, and this outlook gets updated.
Further out: January Gulf Coast refinery maintenance cuts crude demand just as more crude comes back, with Jan/Mar already pricing tightness. It's why the long is a few-weeks view, not a winter view.
The week ahead (London time)
- Tuesday 13:30: US housing starts and building permits (September)
- Tuesday: November WTI expires
- Tuesday 21:30: API weekly crude stocks
- Wednesday 15:30: EIA Weekly Petroleum Status Report
- Thursday 13:30: US weekly jobless claims
- Friday 14:45: US flash PMIs (October)
- Friday 18:00: Baker Hughes US rig count
- Friday 20:30: CFTC Commitments of Traders (positions as of Tuesday)
After this week: Israeli election Tuesday 27th October, US elections Tuesday 3rd November. Gulf headline risk over the next two weekends.
UK clocks go back on Sunday 25th October, US clocks on 1st November. Next week US data is at 12:30 GMT and EIA at 14:30 GMT, an hour earlier than usual in London.
Cracks and Dated Brent–WTI are calculated from EIA daily spot prices against WTI Cushing (latest published: Tuesday 13th October). Timespreads are described from futures settlements, not quoted. Prices are taken from a CFD feed (USOUSD) and can differ from futures prices and from your broker's quotes.